GRS PDS Data Node
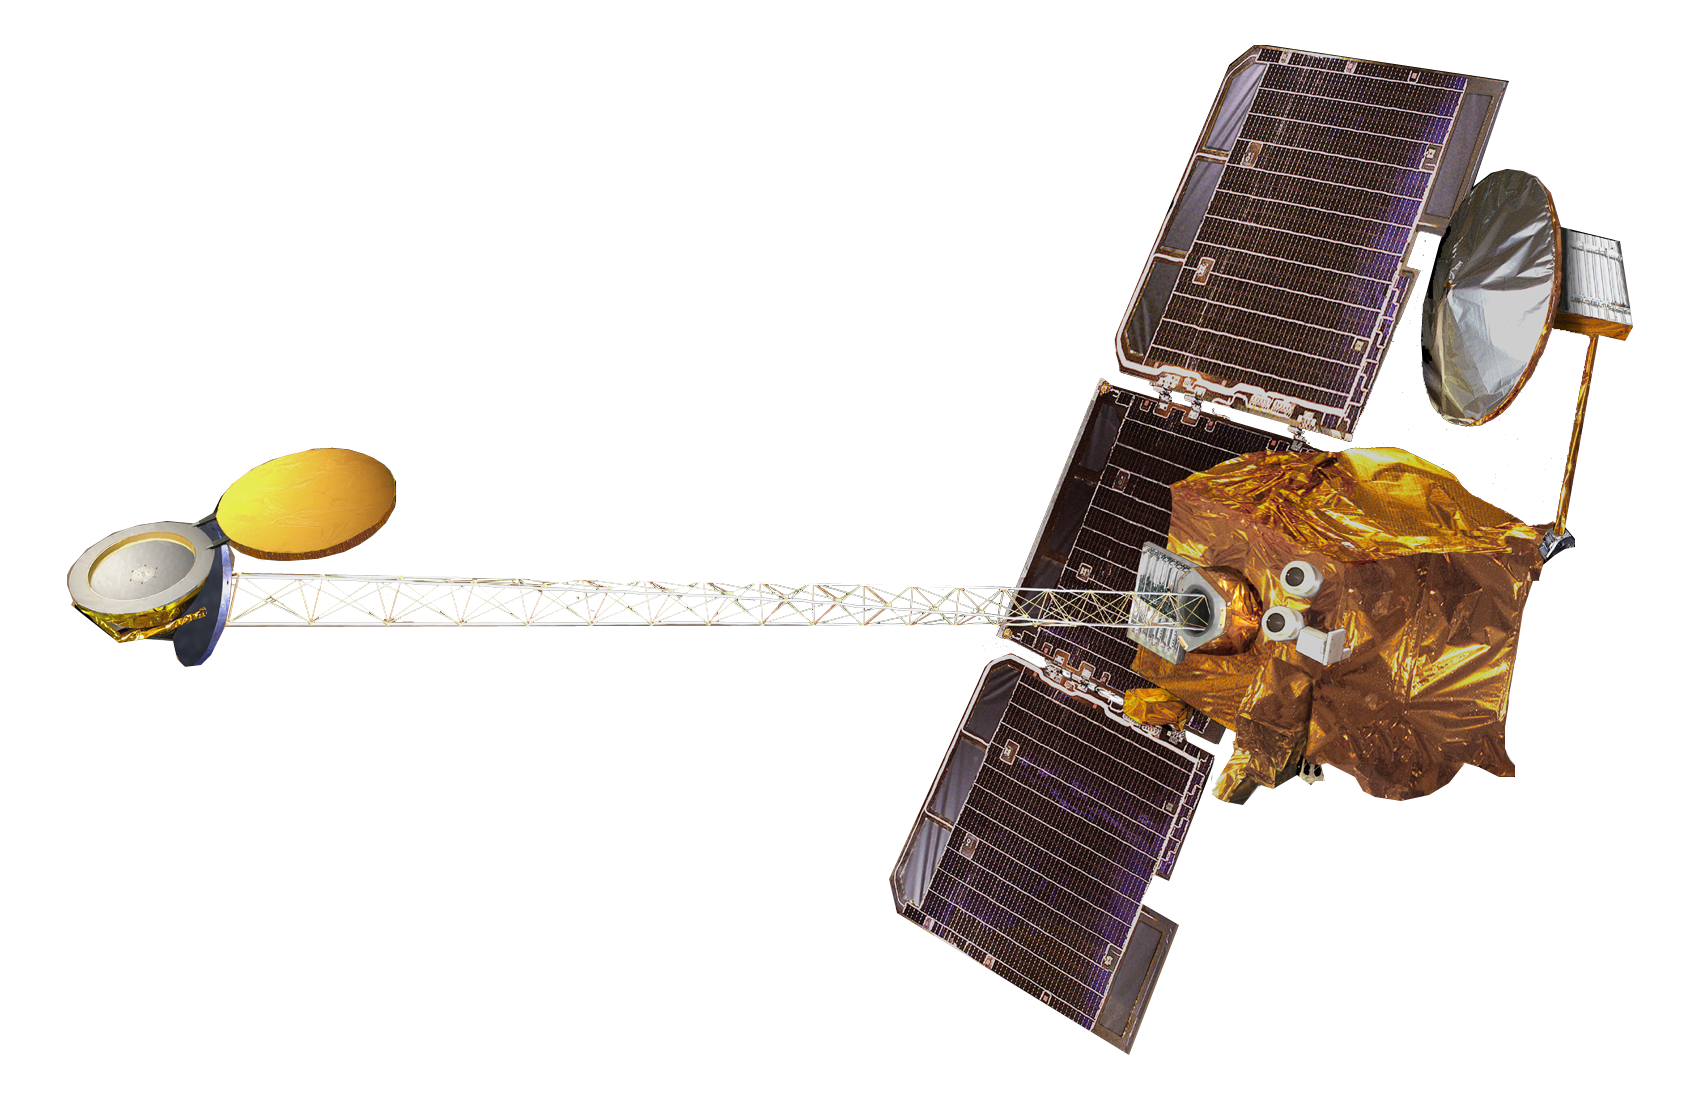
This interface allows you to query the 2001 Mars Odyssey GRS Data Node, a sub-node of the PDS Geosciences Node.
Special capabilities include:
- Access to all GRS products.
- Constrain by time.
- Constrain by latitude-longitude range.
- Create on-the-fly sums.
- Download results in compressed PDS3 archive format.
Please choose a product from the tree (left). The products are grouped into categories: Calibrated, Uncalibrated, Special Products, Software, and Documentation.
Please check the Product Errata page for updates which may affect previously downloaded archives.
For further details, See our Help Pages, contact us by email at karl@lpl.arizona.edu or by phone at (520) 626-7469.
Averaged HEND Data
Averaged HEND Data products are composed of averaged normalized counting rates, orbital neutron fluxes and the associated timing, spatial and engineering information. The AHDs consists of the cumulative background subtracted and normalized counts of neutrons at the four HEND detectors averaged over the 5x5 degree latitude longitude, 15-degree Ls. Please refer to the HEND processing document located in the documents directory that accompanies this release for a full description of how HEND spectra are processed to yield averaged normalized counting rates and orbital neutron fluxes. The timing and spatial data provided with each AHD record include the time and spatial range over which the average was generated.
The description of the data format is here.
| Latitude Minimum, degrees | |
| Latitude Maximum, degrees | |
| Requested total Martian latitude, degrees | |
| East Longitude Minimum, degrees | |
| East Longitude Maximum, degrees | |
| Requested total Martian longitude, degrees | |
| First Mars Season | |
| Last Mars Season | |
| Requested total solar longitude. degrees | |
Averaged Neutron Data
The AND product contains average fluxes for epithermal, thermal, and fast neutrons. The data is presented in a table format for a 5 degree by 5 degree grid. There are 36 latitude bands and 72 longitude bands, thus 2592 grid cells. Each cell corresponds to one row in the table. The first 72 rows in the table are the data for the 5 degree latitude band centered at 87.5 degrees north latitude, the second 72 rows are the data for the band centered at 82.5 degrees north latitude, and so on. Within each band, longitude increases eastward from the cell centered at 2.5 degrees east longitude to the cell centered at 357.5 degrees east longitude.
Averaged Neutron Data v2
The AND product contains average fluxes for epithermal, thermal, and fast neutrons. The data is presented in a table format for a 5 degree by 5 degree grid. There are 36 latitude bands and 72 longitude bands, thus 2592 grid cells. Each cell corresponds to one row in the table. The first 72 rows in the table are the data for the 5 degree latitude band centered at 87.5 degrees north latitude, the second 72 rows are the data for the band centered at 82.5 degrees north latitude, and so on. Within each band, longitude increases eastward from the cell centered at 2.5 degrees east longitude to the cell centered at 357.5 degrees east longitude.
The description of the data format is here.
| Latitude Minimum, degrees | |
| Latitude Maximum, degrees | |
| Requested total Martian latitude, degrees | |
| East Longitude Minimum, degrees | |
| East Longitude Maximum, degrees | |
| Requested total Martian longitude, degrees | |
| First Mars Season | |
| Last Mars Season | |
| Requested total solar longitude. degrees | |
Corrected Gamma Spectra
The gamma data are time series records taken over the course of a day. Data files are labeled with the date. Individual records are composed of corrected gamma spectra and the associated timing, spatial, and engineering information. The gamma spectra consists of the cumulative counts of gamma rays at the detector over one collection interval binned into 16384 channels based on energy. The collection interval is approximately 19.7 seconds, but may vary over the course of mapping. The timing and spatial data provided with the gamma spectra includes spacecraft clock values and spacecraft geometry data. The sc_ev_time, utc time and spatial fields are all recorded at the center of the collection interval.
The description of the data format is here.
| Latitude Minimum, degrees | |
| Latitude Maximum, degrees | |
| Requested total Martian latitude, degrees | |
| East Longitude Minimum, degrees | |
| East Longitude Maximum, degrees | |
| Requested total Martian longitude, degrees | |
| Include data marked with a bad code? | |
| Start time | |
| Stop time | |
Derived HEND Data
Derived HEND data are composed of raw counts, a background component, background subtracted counts and the associated timing and spatial information. The five raw counts fields included in the DHDs consist of the cumulative counts of neutrons at the detector of interest over one collection interval. The collection interval is approximately 19.7 seconds, but may vary over the course of mapping. The five background count fields are derived from spatial data and count data collected during the cruise phase of the mission. The five background subtracted count fields are the background subtracted counts at the detector of interest over one collection interval. Timing and spatial data provided with the counts include spacecraft clock values and spacecraft geometry data. The sc_ev_time, utc time and spatial fields are all recorded at the center of the collection interval.
The description of the data format is here.
| Latitude Minimum, degrees | |
| Latitude Maximum, degrees | |
| Requested total Martian latitude, degrees | |
| East Longitude Minimum, degrees | |
| East Longitude Maximum, degrees | |
| Requested total Martian longitude, degrees | |
| Include data marked with a bad code? | |
| Start time | |
| Stop time | |
Derived Neutron Data
The DND product contains normalized neutron counting rates for all four of the Neutron Spectrometer prisms, from which thermal and epithermal neutron count rates are determined. Thermal and epithermal count rates are included in the data set. Background-corrected and normalized fast counting data are also provided for the nadir-looking prism (Prism 1). The data is presented in a table format with one row of data for each NS collection interval within a 24 Earth hour period. The DND data can be used along with models and calibration procedures described in the literature [Feldman et al., 2003; Prettyman et al., 2004] to study the composition and structure of the surface and atmosphere of Mars on sub-seasonal time scales.
The description of the data format is here.
| Latitude Minimum, degrees | |
| Latitude Maximum, degrees | |
| Requested total Martian latitude, degrees | |
| East Longitude Minimum, degrees | |
| East Longitude Maximum, degrees | |
| Requested total Martian longitude, degrees | |
| Include data marked with a bad code? | |
| Start time | |
| Stop time | |
Derived Neutron Data v2
The DND product contains normalized neutron counting rates for all four of the Neutron Spectrometer prisms, from which thermal and epithermal neutron count rates are determined. Thermal and epithermal count rates are included in the data set. Background-corrected and normalized fast counting data are also provided for the nadir-looking prism (Prism 1). The data is presented in a table format with one row of data for each NS collection interval within a 24 Earth hour period. The DND data can be used along with models and calibration procedures described in the literature [Feldman et al., 2003; Prettyman et al., 2004] to study the composition and structure of the surface and atmosphere of Mars on sub-seasonal time scales.
The description of the data format is here.
This is version 2 of this data set, released with GRS PDS Release 75 on April 1, 2021.
| Latitude Minimum, degrees | |
| Latitude Maximum, degrees | |
| Requested total Martian latitude, degrees | |
| East Longitude Minimum, degrees | |
| East Longitude Maximum, degrees | |
| Requested total Martian longitude, degrees | |
| Include data marked with a bad code? | |
| Start time | |
| Stop time | |
Summed Gamma Spectra
The SGS data set is a collection of data tables that contain a gamma spectrum and the associated engineering data that has been summed over 5-degree by 5-degree latitude-longitude cells on the surface of Mars and over a time period of 15-degrees of solar longitude (Ls). The SGS are produced because the individual gamma spectra collected during an approximately 19.7 second collection interval do not contain enough counts to be statistically significant. The SGS are summed over large enough and long enough spatial and temporal intervals to provide a statistically meaningful spectrum that can be used for scientific data analysis.
The description of the data format is here.
There are four options for this data type:
- The basic data set: Sums within each 5x5 cell for 15° seasons. These downloads are fastest because no additional processing is required. This data product is a 36-by-72 element matrix for each 15° season.
- Sum-over-space: Sums across the globe for each 15° season. This is a time-series product with a single, global value for each 15° season.
- Sum-over-time: A single 36-by-72 element matrix, each element the sum of the that pixel's value over time.
- Sum-over-space-and-time: Produce a global (summed over space), time-reduced (summed over time) value.
Queries of the basic data set are relatively fast. Summing queries take longer to complete because they require additional processing. Please queue queries with care.
| Latitude Minimum, degrees | |
| Latitude Maximum, degrees | |
| Requested total Martian latitude, degrees | |
| East Longitude Minimum, degrees | |
| East Longitude Maximum, degrees | |
| Requested total Martian longitude, degrees | |
| First Mars Season | |
| Last Mars Season | |
| Requested total solar longitude. degrees | |
| Include data with the BAD_DATA flag. | |
| Requested sums: | |
Gamma Spectra
The gamma data are time series records taken over the course of a day. Data files are labeled with the date. Individual records are composed of raw gamma spectra and the associated timing and spatial information. The gamma spectra consists of the cumulative counts of gamma rays at the detector over one collection interval binned into 16384 channels based on energy. The collection interval is approximately 19.7 seconds, but may vary over the course of mapping. The timing and spatial data provided with the gamma spectra includes spacecraft clock values and spacecraft geometry data. The sc_ev_time, utc time and spatial fields are all recorded at the center of the collection interval.
The description of the data format is here.
| Latitude Minimum, degrees | |
| Latitude Maximum, degrees | |
| Requested total Martian latitude, degrees | |
| East Longitude Minimum, degrees | |
| East Longitude Maximum, degrees | |
| Requested total Martian longitude, degrees | |
| Include data marked with a bad code? | |
| Start time | |
| Stop time | |
Neutron Spectra
The NS data are time series records taken over the course of a day. Data files are labeled with the date. Individual records are composed of 15 histograms, event data and the associated timing and spatial information. The neutron event data are the cumulative counts of neutrons detected at 1 of four prisms over the collection interval. The collection interval is approximately 19.7 seconds, but may vary over the course of mapping. The timing and spatial data provided with the neutron spectra includes spacecraft clock values and spacecraft spatial data. The sc_ev_time, utc time and geometry fields are all recorded at the center of the collection interval.
The description of the data format is here.
| Latitude Minimum, degrees | |
| Latitude Maximum, degrees | |
| Requested total Martian latitude, degrees | |
| East Longitude Minimum, degrees | |
| East Longitude Maximum, degrees | |
| Requested total Martian longitude, degrees | |
| Include data marked with a bad code? | |
| Start time | |
| Stop time | |
HEND Spectra
The HEND data are time series records taken over the course of a day. Data files are labeled with the date. Individual records are composed of HEND records and the associated timing and spatial information. HEND records (frames) can be one of three types: nominal (spectra), profile (time series), or status (commands). The nominal frame consists of six spectra, with 16 channels, two bytes per channel. The profile frame consists of the six spectra plus two time profiles. The inner scintillator profile is thirty seconds in duration, with a two-byte count for each second. The outer scintillator profile is also thirty seconds in duration, but has a time resolution of 0.25 seconds, with a two-byte count for each interval. The status frame contains the last 18 HEND commands. The timing and spatial data provided with the HEND data includes spacecraft clock values and spacecraft geometry data. The sc_ev_time, utc time and spatial fields are all recorded at the center of the collection interval.
The description of the data format is here.
| Latitude Minimum, degrees | |
| Latitude Maximum, degrees | |
| Requested total Martian latitude, degrees | |
| East Longitude Minimum, degrees | |
| East Longitude Maximum, degrees | |
| Requested total Martian longitude, degrees | |
| Include data marked with a bad code? | |
| Start time | |
| Stop time | |
Pulser Spectra
The Pulser Spectra data are time series records taken over the course of a day. Data files are labeled with the date. Individual records are a single data collection interval, which lasts approximately 20 seconds. Pulser data are internal spacecraft calibration data. Pulser Spectra are composed of the instrument derived spectra of three artificially produced pulses of energy as well as associated timing and spatial information. During the normal spectrum collection time voltage pulses of known amplitude, and a flag labeling them as pulsers, are sent to the GRS detector at a frequency of 10Hz. These are interpreted by the detector as events and binned in the appropriate channels, but saved in a separate memory location. Pulser spectra are used to evaluate the frequency response and drift of the detector and electronic components as functions of instrument temperatures, voltages, and other variables.
The description of the data format is here.
| Include data marked with a bad code? | |
| Start time | |
| Stop time | |
Profile Data
Profile data are an array of the raw gamma events continuously binned at high time resolution and limited energy resolution. The array length, settable up to 2048 elements, covers the duration of the current pixel. Each element contains four scalars which represent the counts above the Lower Level Discriminator (LLD), between LLD and L1, between L1 and L2, and between L2 and L3. The parameters LLD, L1, L2, and L3 are all settable parameters. These data are sent from the CEB when a burst is detected. At the time of detection the current pixel's profile data along with addition pixel sets are packaged for downlink. The total number of additional sets is a settable parameter and is currently set to 2. The data values are sets of 4 values representing the number of events seen in between the discriminator levels (LLD, L1, L2, L3, ULD) within a settable period (def. 32 ms) over the pixel. This is also referred to as small burst data.
The description of the data format is here.
| Include data marked with a bad code? | |
| Start time | |
| Stop time | |
Command List
The Command List data are time series records taken over the course of a day. Data files are labeled with the date. Individual records are a single data collection interval, which lasts approximately 20 seconds. Command List data are records of the commands issued to the file interchange system (FIS) for up-link to the spacecraft and executed by the CEB. The Command List data are a record of the commands that have been sent to or executed from the spacecraft and the associated timing information. Command data are produced whenever a command is executed. Timing information is stored with the commands, indicating when the command was sent to the spacecraft, the time the command should have been executed, and when the command was executed.
Message Log
The Message Log data are time series records taken over the course of a day. Data files are labeled with the date. Individual records are a single data collection interval, which lasts approximately 20 seconds. The Message Log data are messages returned from the GRS central electronics box (CEB). For a reference to all the message codes and their associated information see the "GRS Flight Software Message Dictionary." The Message Log data consists of the data sent from the CEB in response to some action taking place in the GRS and the associated timing information. The message data includes general messages and warnings as well as CEB error messages. The frequency of message data depends on CEB activity. The timing information (sc_ev_time and utc time) for each message is associated with the actual time the message was produced.
E Kernel
The E-Kernel data consists of the Experimenter's Notes, the list of commands sent, and the associated timing information. These data are produced in response to a set of commands being placed on the FIS.
Channelized
Channelized data are time series records taken over the course of a day. Data files are labeled with the date. Individual records are a single data collection interval, which is variable in duration. Channelized data values are sub-divided by type, and report the processed channelized value. Channelized values are different than engineering values in that they are recorded by the spacecraft computer and are received and processed by JPL, and then ingested into the UA database. The Channelized data are engineering readings from the spacecraft, and the associated timing values. These data are taken by the spacecraft, and sampling intervals are set by the JPL spacecraft team. Some of the channelized readings are only recorded when there is a change in the setting, whereas others are sampled on a regular interval.
Engineering
The Engineering data are time series records taken over the course of a day. Data files are labeled with the date. Individual records are a single data collection interval, which is variable in duration. Engineering values are sub- divided by type, with a parameter name, collection time, raw value, and engineering value. In general, temperatures are reported in Celsius, currents in amps, and potentials in volts. The units field is the definitive source for the units of measure. Engineering values are specific monitor values recorded by the GRS CEB. Engineering data are composed of the 66 different engineering readings monitored in the GRS, and the associated timing information. The engineering readings can be taken at several different time intervals, which can be changed depending on spacecraft operation. Times associated with the individual readings can be used to determine the sampling intervals. The following is a list of all the engineering readings and a description of each.
- b_170k_temp: B_170K Card temperature, in Celcius.
- ceb_ad_temp: A to D converter temperature, in Celcius.
- ceb_agnd: AGND readings, in Volts.
- ceb_agnd_spare1: AGND spare1 voltage, in Volts.
- ceb_agnd_spare2: AGND spare2 voltage, in Volts.
- ceb_agnd_spare3: AGND spare3 voltage, in Volts.
- ceb_alt_act_curr: Alternate actuator current, in Amps.
- ceb_cpu_plus_5: CPU plus 5 voltage, in Volts.
- ceb_cpu_plus_5_curr: CPU plus 5 current, in Amps.
- ceb_cpu_temp: CEB CPU temperature, in Celcius.
- ceb_htr_cntrl_temp: Heater Control temperature, in Celcius.
- ceb_is_temp_a: Inner Stage A temperature, in Celcius.
- ceb_is_temp_b: Inner Stage B temperature, in Celcius.
- ceb_main_actuator_curr: Main actuator current, in Amps.
- ceb_minus_12v_ceb_an: Minus 12 volt analog readings, in Volts.
- ceb_mnt_rng_temp_a: Mounting Ring A temperature, in Celcius.
- ceb_mnt_rng_temp_b: Mounting Ring B temperature, in Celcius.
- ceb_os_temp_a: Outer Stage A temperature, in Celcius.
- ceb_os_temp_b: Outer Stage B temperature, in Celcius.
- ceb_plus_12v_ceb_an: Plus 12 volt readings, in Volts.
- ceb_plus_28_curr: Plus 28 current, in Amps.
- ceb_plus_5_cryo: Plus 5 cryo voltage, in Volts.
- ceb_pc_curr_ref: PC current reference, in Volts.
- ceb_ps_curr_ref: PS current reference, in Volts.
- ceb_ps1_temp: Power supply sensor 1 temperature, in Celcius.
- ceb_ps2_temp: Power supply sensor 2 temperature, in Celcius.
- ceb_spare_curr_sense_2: Spare current sensor, in Amps.
- ceb_spare_curr_sense_3: Spare current sensor, in Amps.
- gamma_overload: Number of counts above 10 MeV.
- gamma_dac_0: DAC 0 readings, in Volts.
- gamma_dac_1: DAC 1 readings, in Volts.
- gamma_dac_2: DAC 2 readings, in Volts.
- gamma_dac_3: DAC 3 readings, in Volts.
- gamma_dac_4: DAC 4 readings, in Volts.
- gamma_dac_5: DAC 5 readings, in Volts.
- gamma_dac_6: DAC 6 readings, in Volts.
- gamma_dac_7: DAC 7 readings, in Volts.
- gamma_elec_fast: Electrometer fast current, in nanoAmps.
- gamma_elec_slow: Electrometer slow current, in nanoAmps.
- gamma_gpa_temp: Gamma Pulse Analyzer temperature, in Celcius.
- gamma_hvbs_enable_mntr: High voltage bias supply enable monitor, in Volts.
- gamma_hvbs_mntr: High voltage bias supply readings, in Volts.
- gamma_hvbs_temp: High voltage bias supply temperature readings, in Celcius.
- gamma_minus_12v_rail_crnt: Minus 12 volt rail current readings, in milliAmps.
- gamma_minus_12v_rail_volt: Minus 12 volt rail readings, in Volts.
- gamma_mux_offset: MUX offset readings, in Volts.
- gamma_plus_12v_rail_crnt: Plus 12 volt rail current readings, in milliAmps.
- gamma_plus_12v_rail_volt: Plus 12 volt rail readings, in Volts.
- gamma_ref_volt_166: 166 Reference voltage, in Volts.
- gamma_ref_volt_333: 333 reference voltage, in Volts.
- gamma_ref_volt_500: 500 reference voltage, in Volts.
- gamma_spare_1: Volts.
- gamma_spare_2: Celcius.
- gamma_vdd_direct_mntr: VDD direct monitor readings, in Volts.
- gamma_vref_temp: V reference temperature readings, in Celcius.
- plus_5v_anlg: Neutron Spectrometer Plus 5 voltage, in Volts.
- minus_5v_anlg: Neutron Spectrometer Minus 5 voltage, in Volts.
- plus_5v_crnt_anlg: Neutron Spectrometer Plus 5 volt current, in milliAmps.
- minus_5v_crnt_anlg: Neutron Spectrometer Minus 5 volt current, in milliAmps.
- plus_5v_crnt_dig: Neutron Spectrometer Plus 5 volt digital current, in milliAmps.
- hvps_mntr_1: Neutron Spectrometer High voltage power supply 1 readings, in Volts.
- hvps_mntr_2: Neutron Spectrometer High voltage power supply 2 readings, in Volts.
- preamp_temp: Neutron Spectrometer Preamp temperature readings, in Celcius.
Journal Articles
- Distribution of Hydrogen in the Near-surface of Mars: Evidence for Sub-surface Ice Deposits W. V. Boynton, W. C. Feldman, S. W. Squyres, T. Prettyman, J. Brückner, L. G. Evans, R. C. Reedy, R. Starr, J. R. Arnold, D. M. Drake, P. A. J. Englert, A. E. Metzger, Igor Mitrofanov, J. I. Trombka, C. d'Uston, H. Wänke, O. Gasnault, D. K. Hamara, D. M. Janes, R. L. Marcialis, S. Maurice, I. Mikheeva, G. J. Taylor, R. Tokar, C. Shinohara, Science 297: 81-85, 2002 July 5.
- Global Distribution of Neutrons from Mars: Results from Mars Odyssey W. C. Feldman, W. V. Boynton, R. L. Tokar, T. H. Prettyman, O. Gasnault, S. W. Squyres, R. C. Elphic, D. J. Lawrence, S. L. Lawson, S. Maurice, G. W. McKinney, K. R. Moore, R. C. Reedy, Science 297: 75-78, 2002 July 5.
- Maps of Subsurface Hydrogen from the High-Energy Neutron Detector, Mars Odyssey I. Mitrofanov, D. Anfimov, A. Kozyrev, M. Litvak, A. Sanin, V. Tret'yakov, A. Krylov, V. Shvetsov, W. Boynton, C. Shinohara, D. Hamara, R. S. Saunders, Science 297: 78-81, 2002 July 5.
Gamma sensor hydrogen peaks
Portions of Odyssey gamma-ray spectra showing emission line due to capture of thermal neutrons by hydrogen.
- grs_h_peaks_020917.lbl [ Label ]
- grs_h_peaks_020917.zip [ Data, 8KB ]
NS epithermal neutron flux
Map of epithermal neutron flux measured by the Neutron Spectrometer over the first 25.7 days of mapping.
- ns_epithermal_020917.lbl [ Label ]
- ns_epithermal_020917.zip [ Data, 742KB ]
NS thermal neutron flux
Map of thermal neutron flux measured by the Neutron Spectrometer over the first 25.7 days of mapping.
- ns_thermal_020917.lbl [ Label ]
- ns_thermal_020917.zip [ Data, 750KB ]
NS fast neutron flux
Map of fast neutron flux measured by the Neutron Spectrometer over the first 25.7 days of mapping.
- ns_fast_020917.lbl [ Label ]
- ns_fast_020917.zip [ Data, 442KB ]
HEND epithermal neutron flux
Map of epithermal neutron flux measured by HEND with energies at 0.4 eV to 100 keV for the first 55 days of mapping.
- hend_epithermal_020917.lbl [ Label ]
- hend_epithermal_020917.zip [ Data, 28KB ]
HEND fast neutron flux
Map of fast neutron flux measured by HEND with energies at 3.4 to 7.3 MeV for the first 55 days of mapping.
- hend_fast_020917.lbl [ Label ]
- hend_fast_020917.zip [ Data, 28KB ]
Documentation
Catalog Information
- Instrument Information
- AHD Data Set Overview
- AND Data Set Overview
- EDR Data Set Overview
- CGS Data Set Overview
- DND Data Set Overview
- DHD Data Set Overview
- SGS Data Set Overview
- References
Software Interface Specifications
- EDR Archive Volume SIS (PDF)
- EDR SIS (PDF)
- Appendix to EDR SIS (PDF)
- IDR SIS (PDF)
Ancillary Documentation
- Bad Code Definitions
- GRS Calibration Report (PDF)
- Neutron Spectrometer Calibration Summary (PDF)
- Description of Gamma Processing Workflow (PDF)
- Description of LANL Neutron Processing (PDF)
- Description of HEND Processing (PDF)
- Description of Clock Corrections (PDF)
- GRS Command Dictionary (PDF)
- GRS Message Dictionary (PDF)
- Gamma Compression Description (PDF)
- Neutron Compression Description (PDF)
- Time Conversion Tables
- Bad Data Timeline (TXT)
Software
Data from the GRS instrument is provided in the PDS3 data format. The GRS PDS Data Node no longer maintains separate tools for processing data in this format. Tools are available, however, for using the data. For example:Links
- PDS Geosciences Node at Washington University in St. Louis.
- PDS Home at NASA JPL.
- Odyssey Home at NASA JPL.
- GRS Home Page at the University of Arizona.